
Migrated from eDJGroupInc.com. Author: Greg Buckles. Published: 2015-08-30 20:00:00Format, images and links may no longer function correctly.
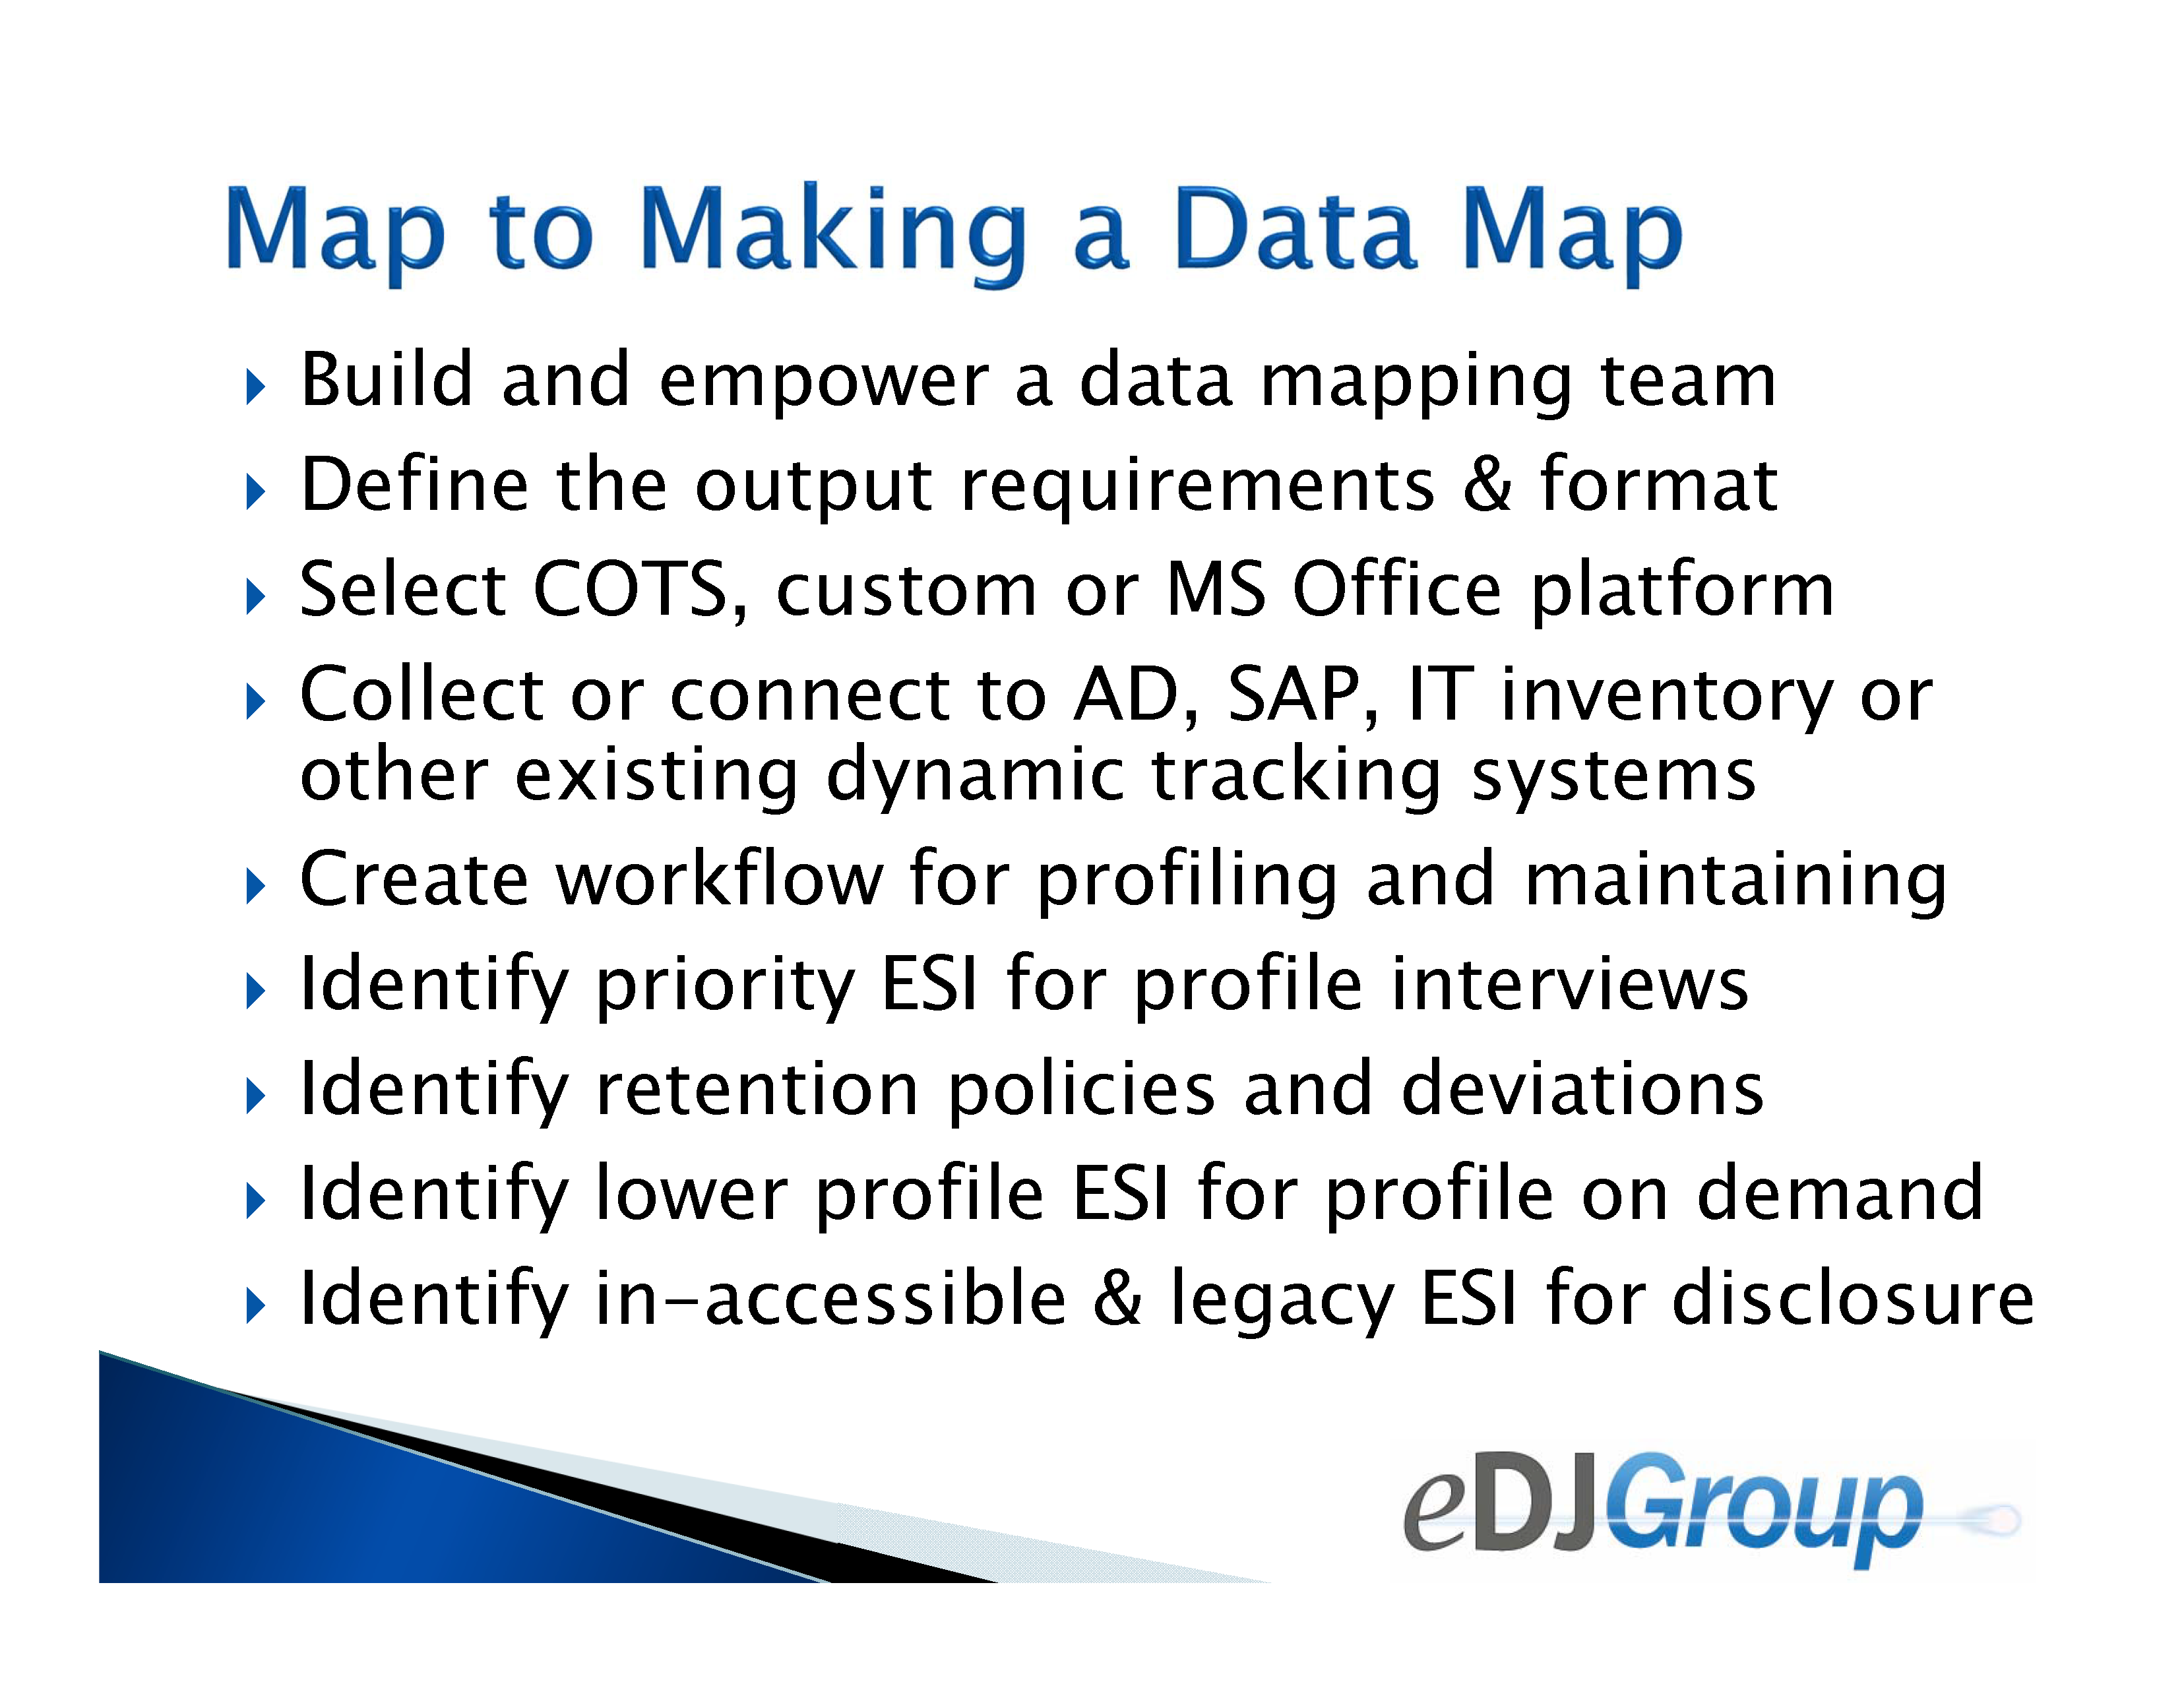
I was refreshing a presentation for a prospective client meeting and thought that I would share a fun slide. A ‘Data Map’ can mean many things, but I always just took it literally as a map to all of your potentially relevant ESI. But the physical locations of your data centers and local hordes of hard drives is less important than relationships to business units, custodians, retention categories and more. I actually enjoy profiling the systems, finding the legacy caches and essentially visualizing the data lifecycle of complex corporations. Every company has evolved a unique set of interdependent systems with their own ESI formats and content. If you are tasked with making a ‘data map’, I hope that this helps you see past the pretty software to the bigger profiling challenge.
Greg Buckles wants your feedback, questions or project inquiries at Greg@eDJGroupInc.com. Contact him directly for a ‘Good Karma’ call. His active research topics include analytics, mobile device discovery, the discovery impact of the cloud, Microsoft’s Office 365/2013 eDiscovery Center and multi-matter discovery. Recent consulting engagements include managing preservation during enterprise migrations, legacy tape eliminations, retention enablement and many more.
Blog perspectives are personal opinions and should not be interpreted as a professional judgment. eDJ consultants are not journalists and perspectives are based on public information. Blog content is neither approved nor reviewed by any providers prior to being posted. Do you want to share your own perspective? eDJ Group is looking for practical, professional informative perspectives free of marketing fluff, hidden agendas or personal/product bias. Outside blogs will clearly indicate the author, company and any relevant affiliations.